ESG & Sustainability Reporting
Explore our range of public relations services tailored towards sustainability
Report writing & editing
Creating data-driven reports with clear and accessible insights for stakeholders
NISRG helps you create annual reports, sustainability assessments, ESG reports, and research studies. We simplify the data collection, writing, data visualisation, and editing stages for you and stay true to your brand identity.

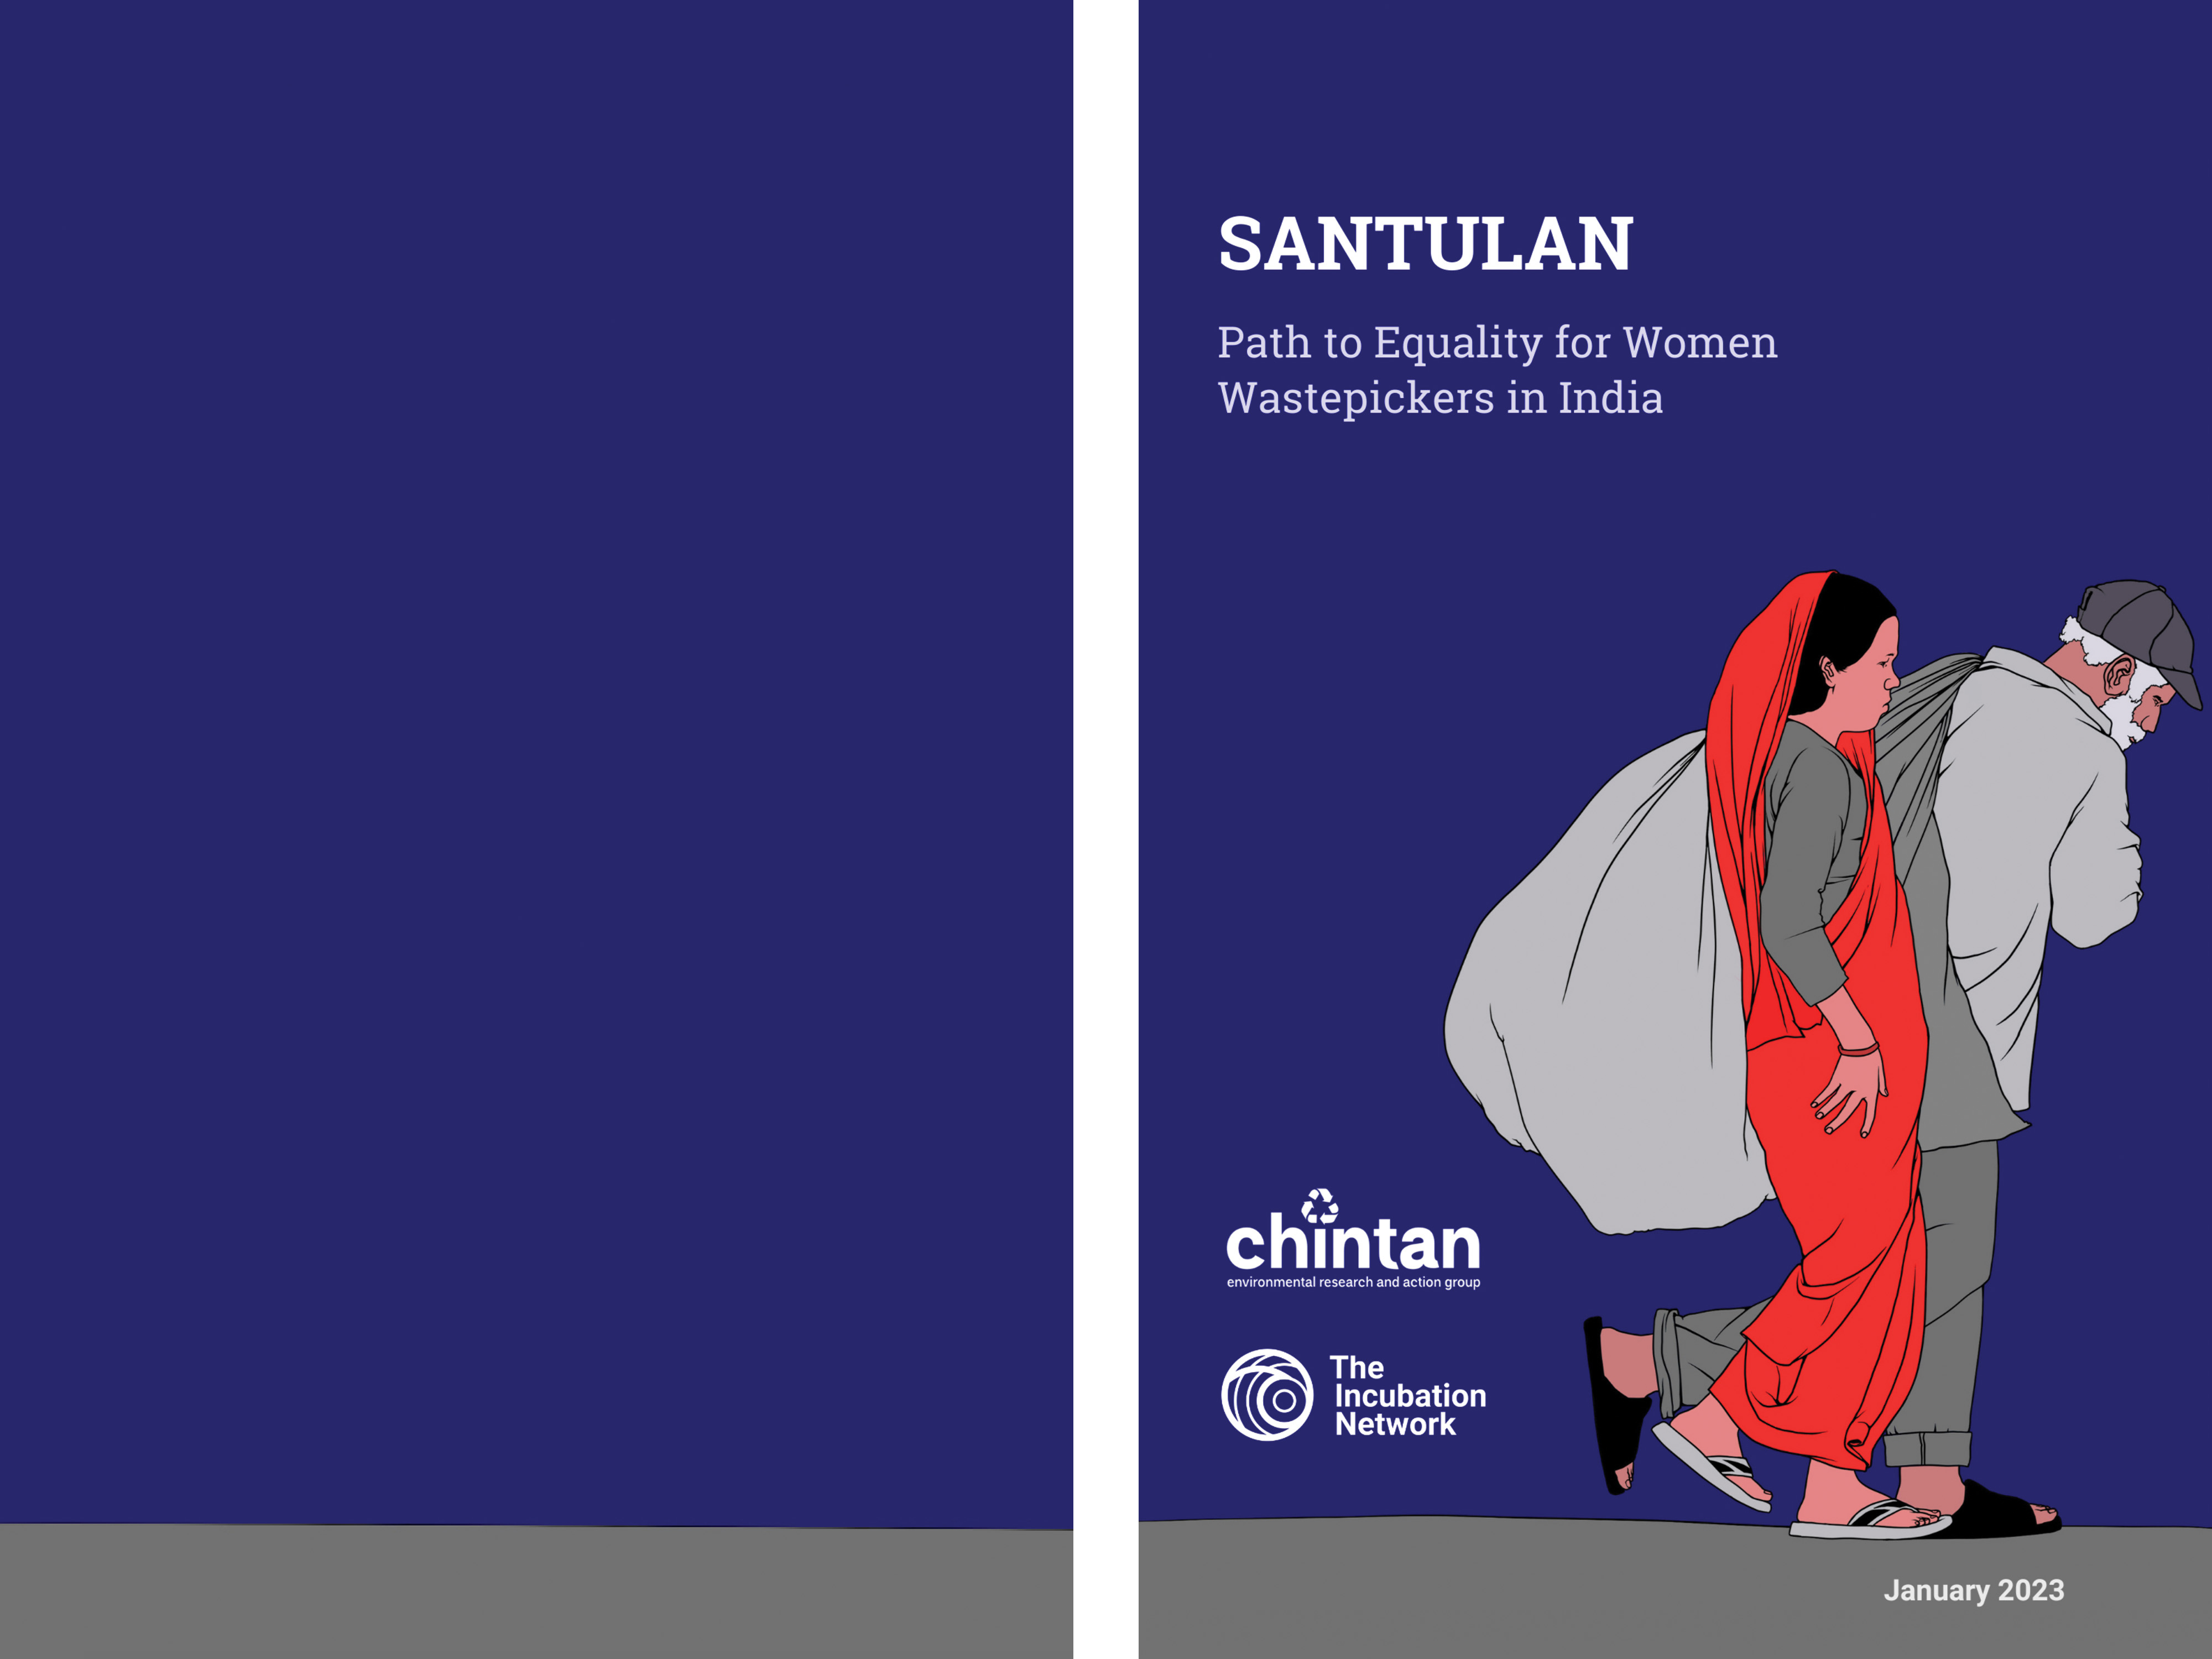
Report design
Designing high quality, crisp reports that engage readers across backgrounds
We design reports that stun and convey data with ease. We emphasise on clarity and accessibility to make your report stand out from the crowd. We believe in the power of art to tell your story and we showcase your data with utmost attention to detail.

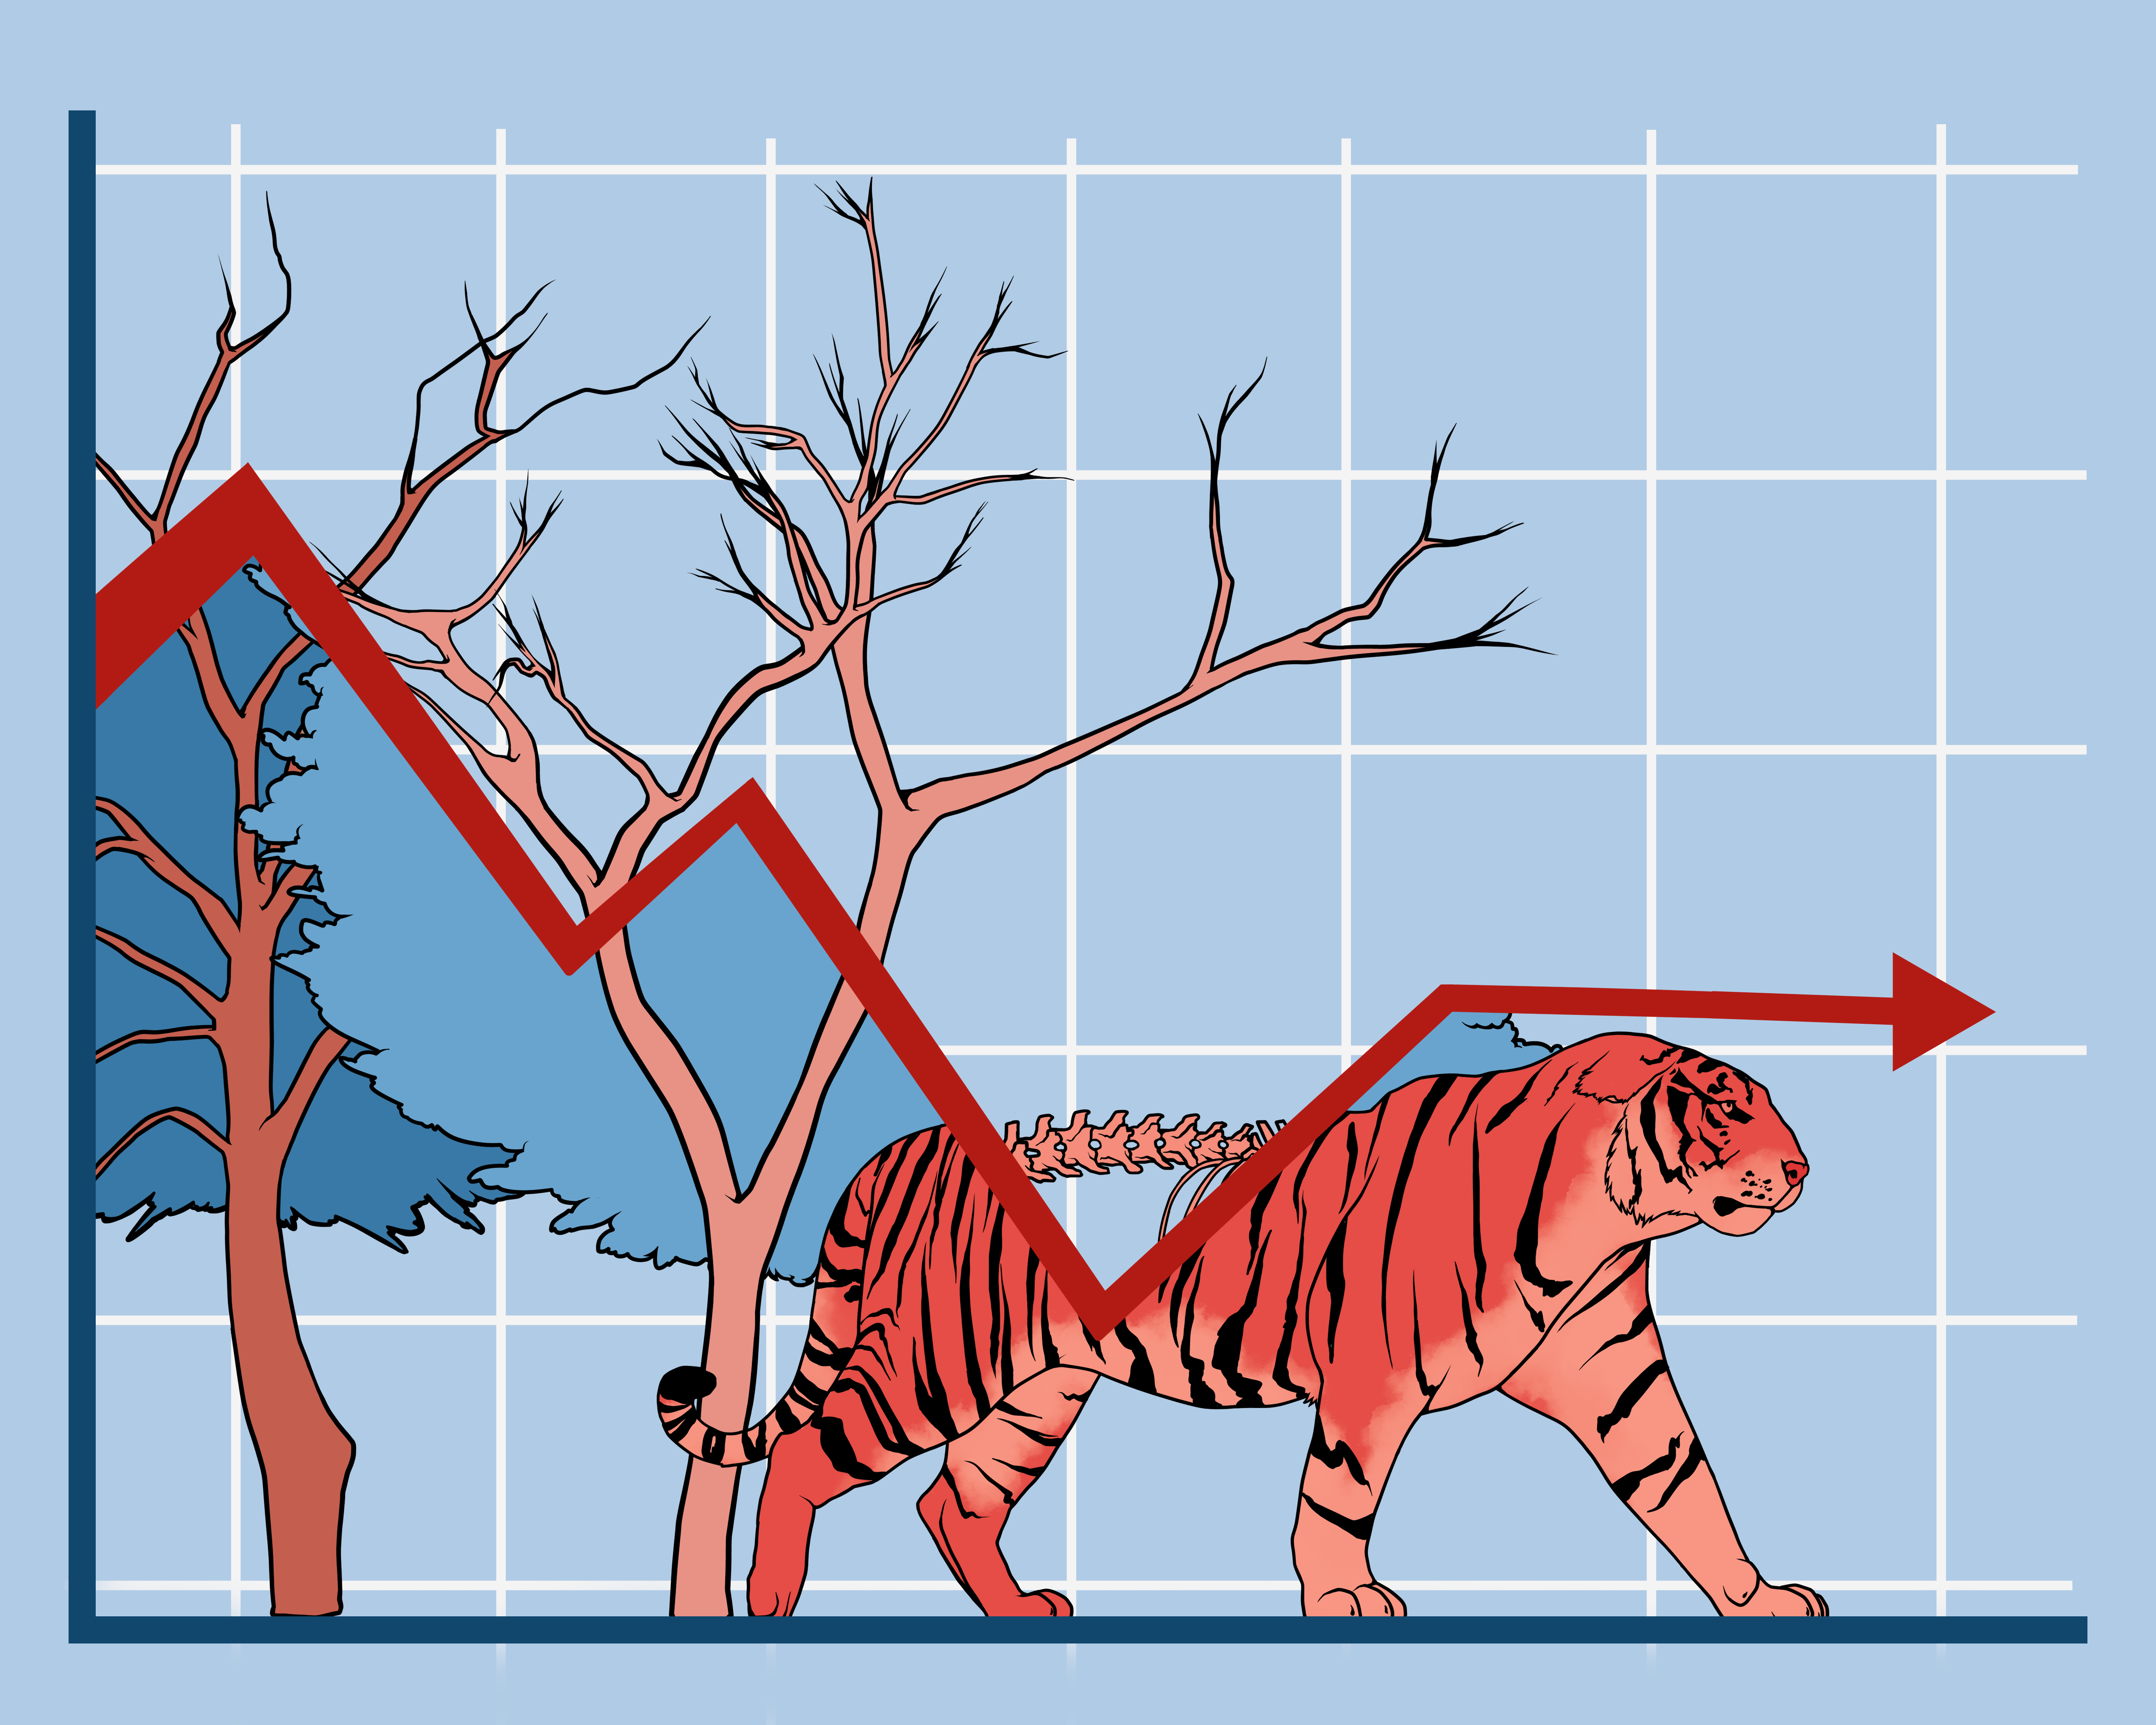
Data visualisation
Data visualisation with storytelling to add new insights and make your data beautiful
Data can be beautiful, accessible, and impactful when visualised correctly. NISRG's data visualisation expertise extends from static visuals for print and reports to web based visuals with interactive elements.

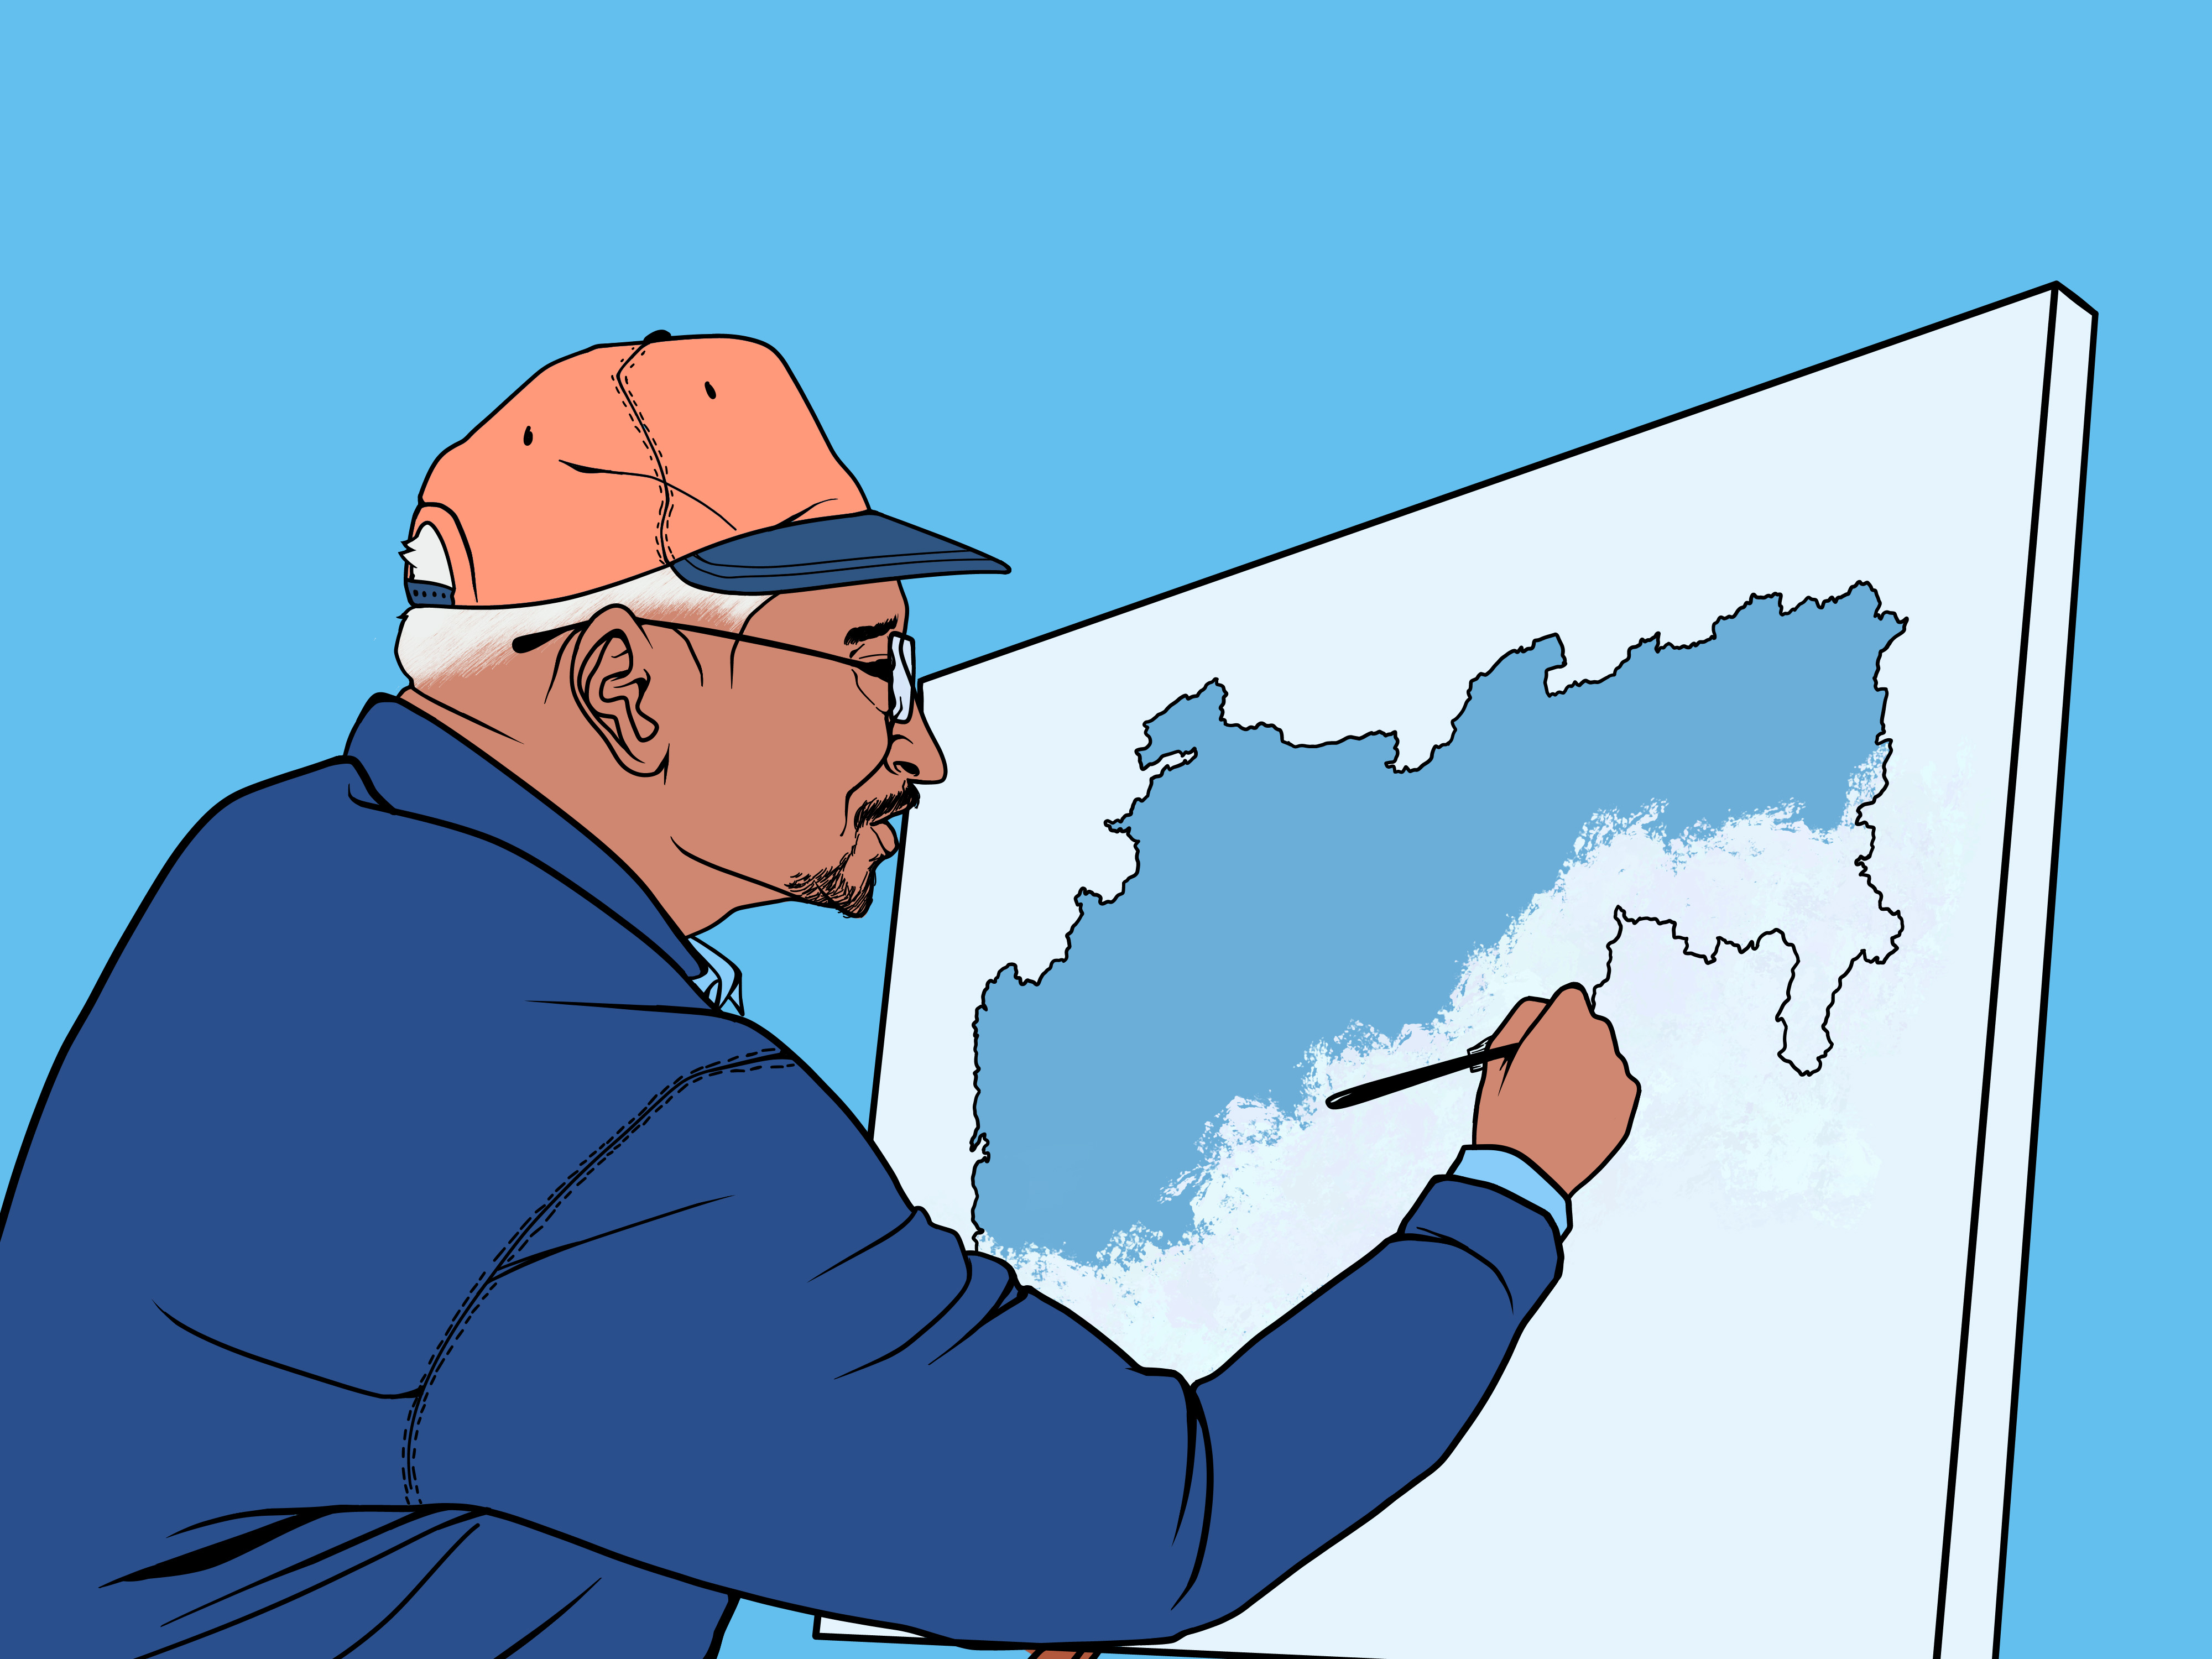
Cartography
Creating a variety of raster and vector maps to illustrate your data
Maps are excellent tools for data visualisation and can help your company tell a story about your impact. NISRG provides expertise to fulfil your mapping needs for data visualisation, statistical analysis, and creating data for decision-making. We work with raster and vector data to deliver analysis and visuals that support your work.
